Editor’s Note: This story originally appeared on Daily Drop.
The year 2023 marked a significant milestone as U.S. international travel surpassed pre-pandemic levels for the first time since COVID-19 disrupted global tourism. Building on this momentum, 2024 is poised to set new records, with Americans traveling abroad in unprecedented numbers.
This surge has been driven by a combination of factors, including pent-up demand, more flexible work arrangements, and favorable airfares.
The frequency of overseas travel varies significantly by state and city of residence.
To find the cities where travelers venture abroad the most, researchers from Daily Drop analyzed data from the U.S. Department of Commerce. See the methodology at the end for additional information.
Here are the cities with residents traveling overseas the most.
15. Orlando, FL

- Overseas trips per 1K population (2023): 195.0
- Total overseas trips (2023): 539,000
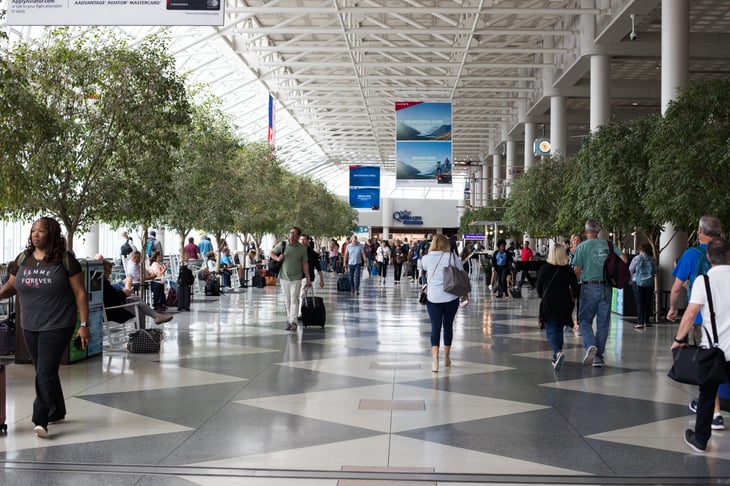
- Total overseas trips (2019): 358,000
- Percentage change in overseas trips (2019–2023): +50.6%
- Average trip length (days): 12.9
- Most popular destinations for travelers: United Kingdom; Spain; Colombia
14. Chicago, IL

- Overseas trips per 1K population (2023): 207.1
- Total overseas trips (2023): 1,469,000
- Total overseas trips (2019): 1,389,000
- Percentage change in overseas trips (2019–2023): +5.8%
- Average trip length (days): 13.7
- Most popular destinations for travelers: United Kingdom; France; Italy
13. Los Angeles, CA

- Overseas trips per 1K population (2023): 216.5
- Total overseas trips (2023): 2,105,000
- Total overseas trips (2019): 1,972,000
- Percentage change in overseas trips (2019–2023): +6.7%
- Average trip length (days): 13.9
- Most popular destinations for travelers: United Kingdom; Japan; Italy
12. Boston, MA

- Overseas trips per 1K population (2023): 217.8
- Total overseas trips (2023): 441,000
- Total overseas trips (2019): 807,000
- Percentage change in overseas trips (2019–2023): -45.4%
- Average trip length (days): 11.2
- Most popular destinations for travelers: United Kingdom; France; Italy
11. Atlanta, GA

- Overseas trips per 1K population (2023): 243.9
- Total overseas trips (2023): 1,518,000
- Total overseas trips (2019): 1,031,000
- Percentage change in overseas trips (2019–2023): +47.2%
- Average trip length (days): 12.0
- Most popular destinations for travelers: United Kingdom; Jamaica; India
10. Santa Ana, CA

- Overseas trips per 1K population (2023): 248.5
- Total overseas trips (2023): 783,000
- Total overseas trips (2019): 583,000
- Percentage change in overseas trips (2019–2023): +34.3%
- Average trip length (days): 13.9
- Most popular destinations for travelers: Italy; France; Japan
9. Charlotte, NC

- Overseas trips per 1K population (2023): 248.5
- Total overseas trips (2023): 685,000
- Total overseas trips (2019): 403,000
- Percentage change in overseas trips (2019–2023): +70.0%
- Average trip length (days): 8.3
- Most popular destinations for travelers: Dominican Republic; Jamaica; United Kingdom
8. West Palm Beach, FL

- Overseas trips per 1K population (2023): 258.2
- Total overseas trips (2023): 392,000
- Total overseas trips (2019): 403,000
- Percentage change in overseas trips (2019–2023): 2.7%
- Average trip length (days): 10.9
- Most popular destinations for travelers: United Kingdom; Colombia; Jamaica
7. Washington, D.C.

- Overseas trips per 1K population (2023): 261.2
- Total overseas trips (2023): 1,665,000
- Total overseas trips (2019): 1,210,000
- Percentage change in overseas trips (2019–2023): +37.6%
- Average trip length (days): 11.7
- Most popular destinations for travelers: United Kingdom; France; Italy
6. San Jose, CA

- Overseas trips per 1K population (2023): 278.0
- Total overseas trips (2023): 539,000
- Total overseas trips (2019): 493,000
- Percentage change in overseas trips (2019–2023): +9.3%
- Average trip length (days): 17.1
- Most popular destinations for travelers: Taiwan; India; United Kingdom
5. Seattle, WA

- Overseas trips per 1K population (2023): 299.3
- Total overseas trips (2023): 930,000
- Total overseas trips (2019): 717,000
- Percentage change in overseas trips (2019–2023): 29.7%
- Average trip length (days): 17.0
- Most popular destinations for travelers: Japan; United Kingdom; France
4. Fort Lauderdale, FL

- Overseas trips per 1K population (2023): 402.2
- Total overseas trips (2023): 783,000
- Total overseas trips (2019): 672,000
- Percentage change in overseas trips (2019–2023): +16.5%
- Average trip length (days): 11.0
- Most popular destinations for travelers: Jamaica; Colombia; Dominican Republic
3. New York, NY

- Overseas trips per 1K population (2023): 426.7
- Total overseas trips (2023): 5,092,000
- Total overseas trips (2019): 3,137,000
- Percentage change in overseas trips (2019–2023): +62.3%
- Average trip length (days): 12.9
- Most popular destinations for travelers: Dominican Republic; United Kingdom; Jamaica
2. San Francisco, CA

- Overseas trips per 1K population (2023): 509.2
- Total overseas trips (2023): 783,000
- Total overseas trips (2019): 627,000
- Percentage change in overseas trips (2019–2023): +24.9%
- Average trip length (days): 15.7
- Most popular destinations for travelers: China; Taiwan; United Kingdom
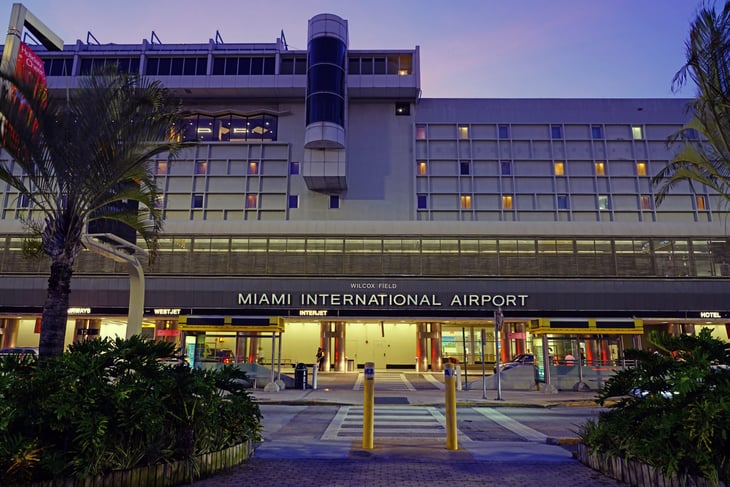
1. Miami, FL

- Overseas trips per 1K population (2023): 622.7
- Total overseas trips (2023): 1,665,000
- Total overseas trips (2019): 1,568,000
- Percentage change in overseas trips (2019–2023): +6.2%
- Average trip length (days): 10.1
- Most popular destinations for travelers: Colombia; Dominican Republic; Spain
Methodology

The data used in this report is from the U.S. Department of Commerce’s Survey of International Air Travelers Program, which measures outbound air travel conducted by U.S. residents to overseas destinations (not including Mexico or Canada).
All location data shown is for 2023 and represents the metropolitan statistical area or state of residence for the travelers. Because travelers may visit multiple destinations on any given trip, destination visitation statistics do not sum to the total number of trips.
To improve accuracy, certain destinations with small numbers of visits were excluded from the analysis.
